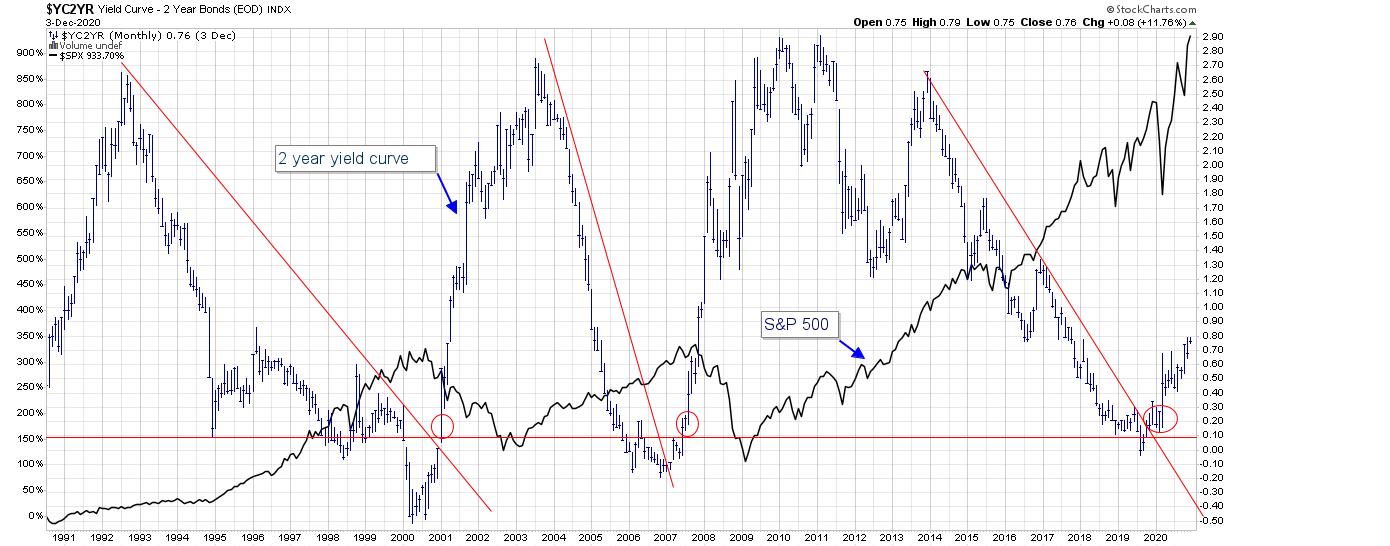
2-Year Yield Curve In Historically Vulnerable Territory
The 2-year yield curve continues to steepen. Historically, over the last twenty years, as the yield curve steepened, this coincided with a drop in equities. The below chart overlays the 2-year yield curve with the S&P 500. We are around the point in which equities began a multi-year decline. While U.S. equities retraced over 30% in March 2020, this drawdown doesn’t compare to that of 2000-2003 and 2007-2009. Therefore, investors should be reminded that a significant drop in equities could begin over the next 18 months could occur.